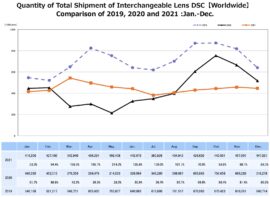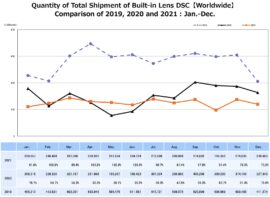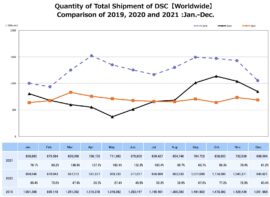


CIPA (Camera & Imaging Products Association in Japan) published their latest camera production data for 2021 (orange: 2021, black: 2020, blue: 2019):
2021 Final Full Year CIPA numbers
Mirrorless now had a 59% unit share of ILC’s and a 78% shipped value share (of DSLR + Mirrorless).
Based on the first eleven months of 2021 and last year’s shipping patterns, we last predicted a full year estimate of 5.346 to 5.432 million ILC units shipped compared to:
- 2020: 5.308 million
- 2019: 8.462 million
- 2018: 10.76 million
- 2017: 11.68 million
2021 came in at 5.348 million units, so 2021 came in at just 40,000 units above 2020. How much of this is because of pandemic related supply issues and the chip shortage and how much of it is because of lower demand is open to question. (Canon had predicted a full fiscal year industry estimate of 6 million units and they claimed they’d take 50% of that, but they estimated too high.)
Full Year 2021 Units & Shipped Value:
(All comparisons to full year 2020)
DSLR Units : 2.242 million -5.6% YTD
DSLR Shipped Value: ¥91.3 billion -5.6% YTD
Mirrorless Units: 3.106 million +6% YTD
Mirrorless Shipped Value: ¥325 billion +31% YTD
Compact Units: 3.103 million -16% YTD
Compact Shipped Value: ¥73.10 billion -4% YTD
Lenses for smaller than 35mm Units: 4.964 million -8% YTD
Lenses for smaller than 35mm Shipped Value: ¥77.1 billion +1% YTD
Lenses for 35mm and larger Units: 4.586 million, +27% YTD
Lenses for 35mm and larger Shipped Value: ¥263.2 billion +49% YTD
Cumulative 2021 Mirrorless unit share (of Mirrorless + DSLR): 58.1% (was 55.3% 2020)
Cumulative 2021 Mirrorless Shipped Value share: 78% (was 71.9% 2020)
The ratio of lenses shipped to bodies shipped is 1.78 for 2021. It was 1.71 for 2020.
Full Year 2021 Geographic Share:
DSLR:
- Units: China 11.4%, Asia (not incl. China or Japan) 13.1%, Japan 3.7%, Europe 38.1%, Americas 31.9%, Other 1.7%
- Shipped Value: China 18.9%, Asia (not incl. China or Japan) 14.9%, Japan 5%, Europe 32.5%, Americas 26.9%, Other 1.8%
Mirrorless:
- Units: China 22.4%, Asia (not incl. China or Japan) 14.2%, Japan 9.8%, Europe 24.2%, Americas 25.8%, Other 3.6%
- Shipped Value: China 25%, Asia (not incl. China or Japan) 14.4%, Japan 8.6%, Europe 21.2%, Americas 26.8%, Other 4.1%
Compacts:
- Units: China 8.1%, Asia (not incl. China or Japan) 9.3%, Japan 25.6%, Europe 31.4%, Americas 22.4%, Other 3.3%
- Shipped Value: China 13%, Asia (not incl. China or Japan) 10.6%, Japan 19.2%, Europe 30.9%, Americas 23.3%, Other 3%
Lenses:
- Units: China 16.2%, Asia (not incl. China or Japan) 12.3%, Japan 8.3%, Europe 30%, Americas 30.2%, Other 3%
- Shipped Value: China 18.4%, Asia (not incl. China or Japan) 12.5%, Japan 9.4%, Europe 26.6%, Americas 29.1%, Other 3.9%
List of participating CIPA companies can be found here.
Source: CIPA (thanks ZoetMB)


