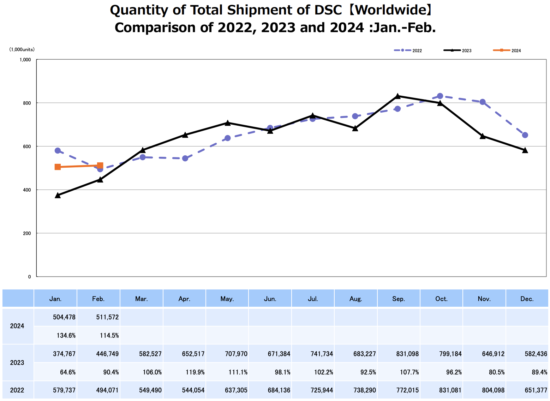
CIPA (Camera & Imaging Products Association in Japan) published their latest camera production data (orange: 2024, black: 2023, blue: 2022):
February 2024 CIPA numbers by ZoetMB
Everything is up compared to YTD 2023, but there are a few interesting anomalies: DSLR units are up 2% YTD, but shipped value is up 10%, indicating that the models remaining are higher priced. It’s similar with compacts: units are exactly the same as last YTD, but shipped value is 28% higher. However, the ratio of lenses to bodies shipped is again down slightly and mirrorless share (of mirrorless + DSLR) has been dropping slightly.
CIPA has predicted 5.89m ILCs, 1.52m compacts and 9.57m lenses for calendar 2024, but based on the trends of the first two months and the ship patterns of 2023, ILC shipments might be substantially higher.
That compares to:*
2023: 6.001 million bodies (+1.25%), 9.639 million lenses (-0.92%).
2022: 5.927 million bodies (+10.8%), 9.7 million lenses (+1.6%).
2021: 5.348 million bodies (+0.75%), 9.55 million lenses (+6.1%)
2020: 5.308 million bodies (-37.3%), 9 million lenses (-36.6%)
2019: 8.462 million bodies (-21.4%), 14.2 million lenses (-21.1%)
2018: 10.76 million bodies (-7.9%), 18 million lenses (-6.4%)
2017: 11.68 million bodies (+0.6%) 19.22 million lenses (+0.156%)
2016: 11.61 million bodies (-11.1%), 19.19 million lenses (-11.6%)
2015: 13.06 million bodies (-5.6%), 21.7 million lenses (-5.2%)
2014: 13.84 million bodies (-19.2%), 22.9 million lenses (-14.2%)
2013: 17.13 million bodies (-15%), 26.7 million lenses (-12.2%)
2012: 20.16 million bodies (+28.5%), 30.4 million lenses (+16.9%)
2011: 15.69 million bodies (+21.7%), 26.0 million lenses (+19.9%)
2010: 12.89 million bodies (+30%), 21.69 million lenses (+34.7%)
2009: 9.91 million bodies (+2.2%), 16.1 million lenses (+2.5%)
2008: 9.7 million bodies (+17.4%), 15.7 million lenses (+25.6%)
2007: 8.26 million bodies, 12.5 million lenses
*Bodies = ILC bodies
February 2024: Cumulative Units & Shipped Value:
(All comparisons to YTD 2023)
DSLR Units : 136.7K +2% YTD
DSLR Shipped Value: ¥6.81 billion +10% YTD
Mirrorless Units: 642K +43% YTD
Mirrorless Shipped Value: ¥76.7 billion +47% YTD
Compact Units: 237.4K +0% YTD
Compact Shipped Value: ¥12.31 billion +28% YTD
Lenses for smaller than 35mm sensors Units: 668K +29% YTD
Lenses for smaller than 35mm sensor Shipped Value: ¥13.8 billion +33% YTD
Lenses for 35mm and larger sensors Units: 614K +5% YTD
Lenses for 35mm and larger sensors Shipped Value: ¥50.6 billion +16% YTD
Cumulative 2024 Mirrorless unit share (of Mirrorless + DSLR): 82.4% (was 77% YTD 2023)
Cumulative 2024 Mirrorless Shipped Value share: 91.9% (was 89.4% YTD 2023)
The ratio of lenses shipped to bodies shipped is 1.65 for YTD 2024. (was 1.89 for YTD 2023).
Full-year 2024 Geographic Share: (Asia doesn’t include China or Japan)
DSLR:
Units: China 09.6%, Asia 09.8%, Japan 5.5%, Europe 32.6%, Americas 41.4%, Other 1.4%
Shipped Value: China 14.9%, Asia 11.3%, Japan 6.1%, Europe 29.0%, Americas 37.6%, Other 1.1%
Mirrorless:
Units: China 23.0%, Asia 18.2%, Japan 11.0%, Europe 20.3%, Americas 23.4%, Other 4.1%
Shipped Value: China 24.1%, Asia 18.1%, Japan 09.5%, Europe 19.4%, Americas 23.5%, Other 5.3%
Compacts:
Units: China 07.5%, Asia 11.8%, Japan 22.4%, Europe 21.8%, Americas 30.4%, Other 6.2%
Shipped Value: China 11.6%, Asia 14.0%, Japan 13.6%, Europe 23.3%, Americas 30.7%, Other 6.7%
Lenses:
Units: China 19.2%, Asia 16.5%, Japan 11.5%, Europe 23.7%, Americas 25.4%, Other 3.7%
Shipped Value: China 24.6%, Asia 17.4%, Japan 10.3%, Europe 21.1%, Americas 21.9%, Other 4.7%
Approximate shipped value per unit (at ¥151.61=$1):
DSLR: $329
Mirrorless: $788
Compact: $342
Lenses: $331


