![]()
Nikon released its latest financial results for the 2nd quarter of the year ending on March 31, 2026. Here are the results for the first half of the financial year:
- Revenue: ¥312.9B (Down ¥19.8B YoY). Revenue was down on FX effects in Imaging Products and Healthcare, in addition to reduced sales in Semiconductor Lithography and Digital Manufacturing, despite increased sales in Components.
- Operating profit: -¥4.8B (Down ¥10.6B YoY). Operating profit was down as FX effects and product mix changes in Imaging Products, reduced revenue in Digital Manufacturing, and tariff impacts outweighed the effects from restructuring in Semiconductor Lithography and Industrial Solutions, and the booking of a gain on the transfer of the semiconductor wafer bonding technology R&D business in Precision Equipment
- The revenue and profit forecasts for the year have been lowered, but we got an upward revenue revision for the Imaging Business:
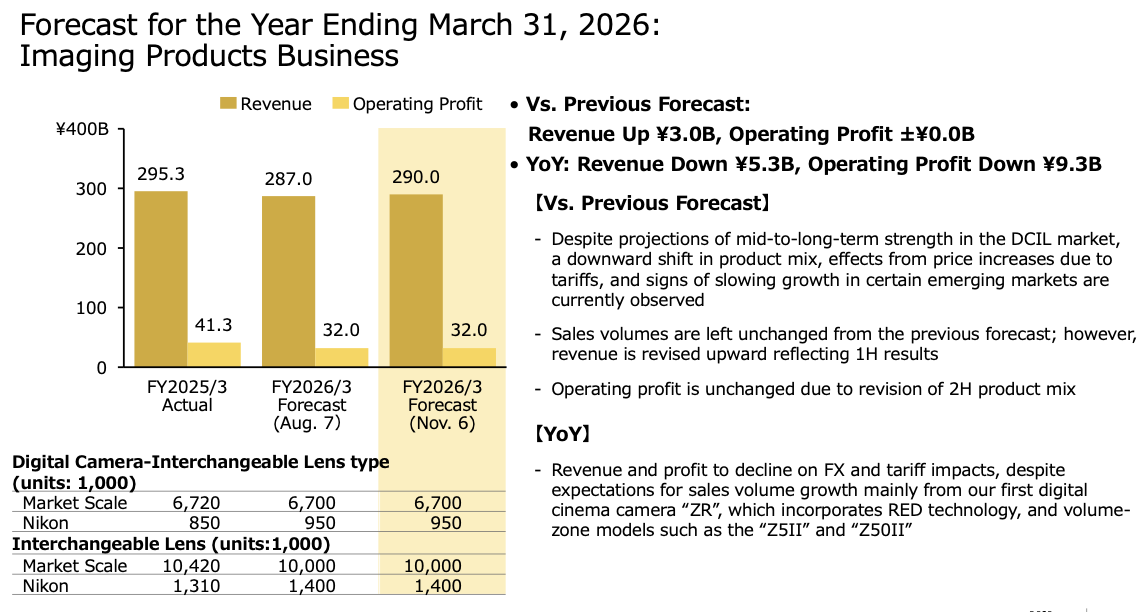
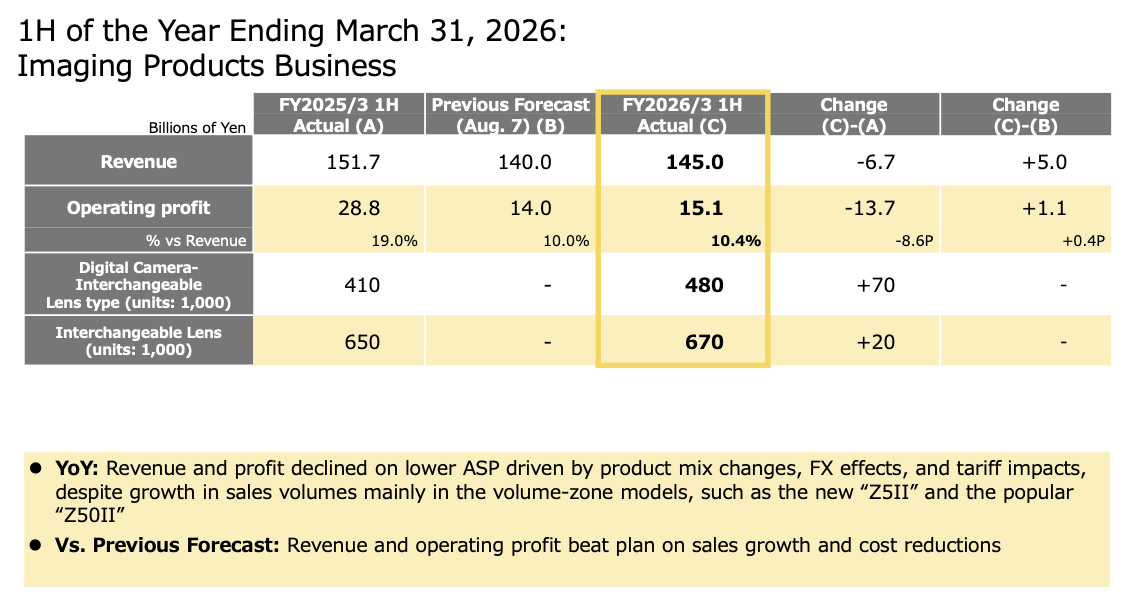
Next are the details for the Nikon Imaging Products Business (revenue and profit declined despite growth in sales volumes, mainly in the volume-zone models, such as the new Nikon Z5II and the popular Nikon Z50II):
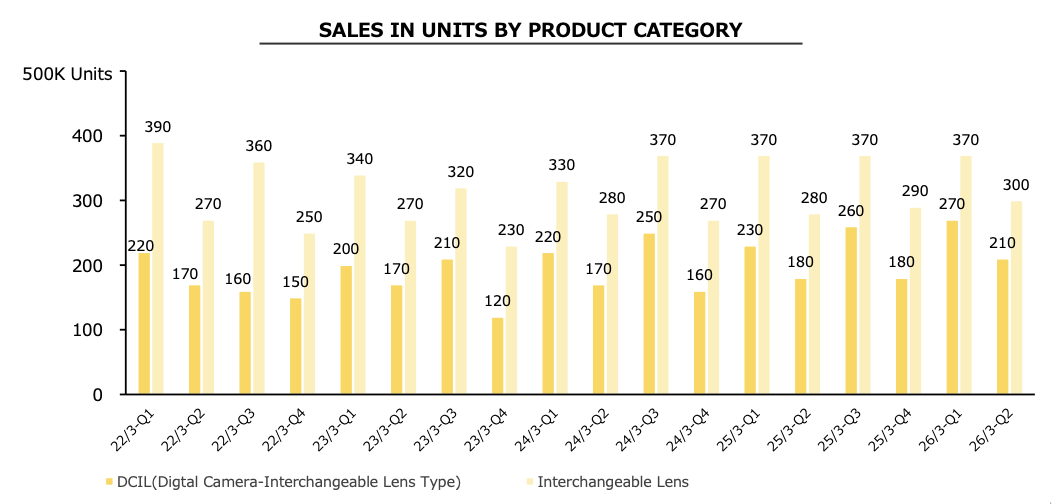
Nikon Imaging Products Business Sales Units:
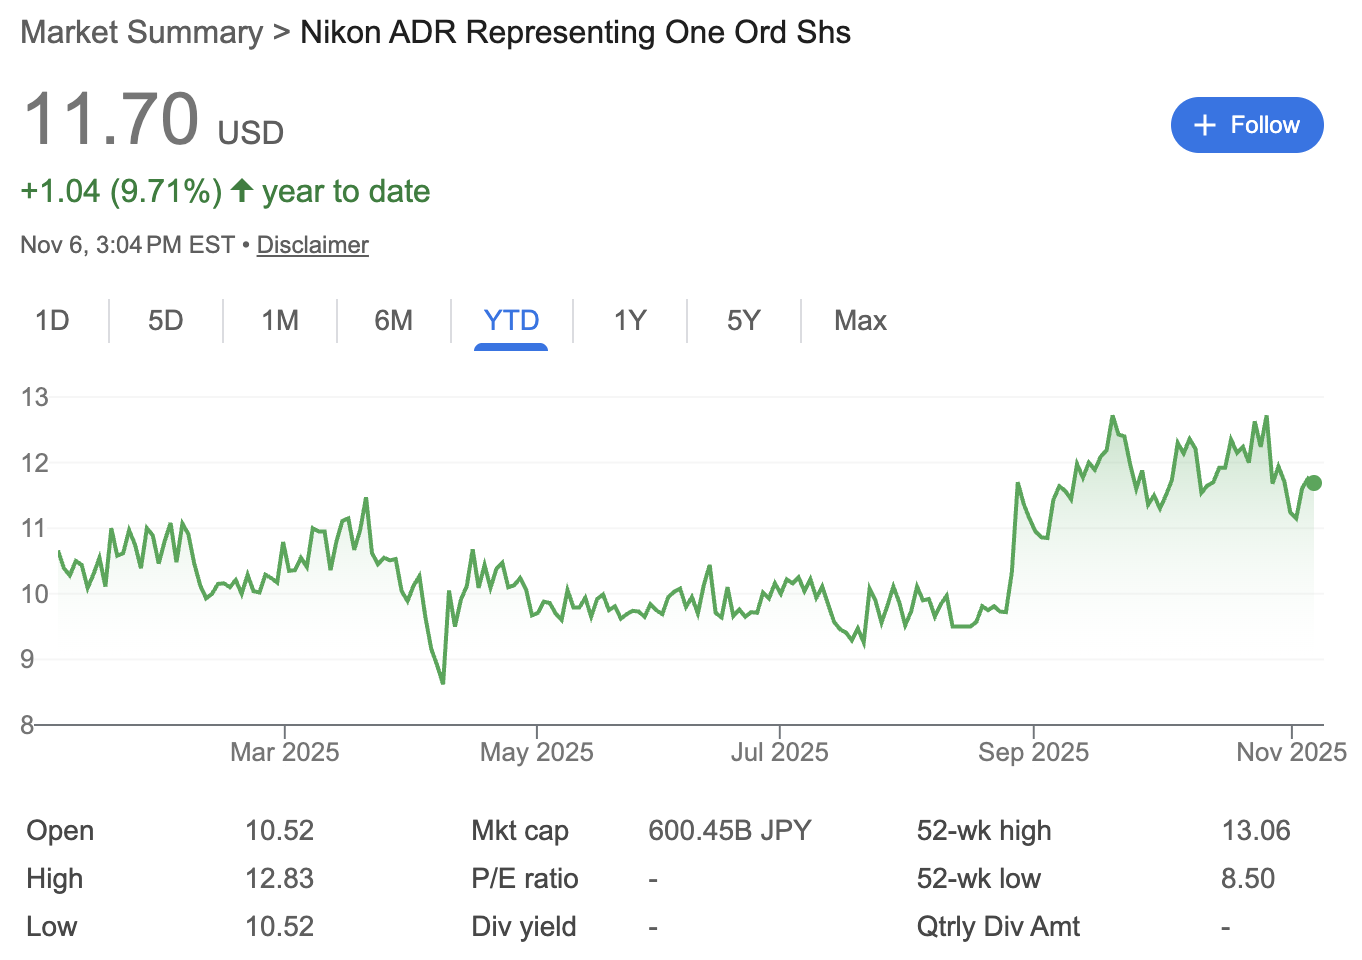
The latest Nikon stock price (YTD):
Here is a detailed recap of the latest Nikon financial results (source Nikon):
Nikon Q2 FY2026 Financial Results Recap
Nikon Corporation released its financial results for the second quarter (Q2) and first half (1H) of the fiscal year ending March 31, 2026, on November 6, 2025. The results reflect challenges from foreign exchange impacts, tariffs, and market conditions, but also include positive developments like business restructuring gains and product launches. Below is a summary of key metrics, segment performances, highlights, and updated full-year forecasts.
Key Consolidated Financial Figures
For Q2 (July-September 2025):
- Revenue: ¥154.8 billion (-8.3% YoY from ¥168.9 billion).
- Operating Profit: -¥3.7 billion (down ¥6.6 billion YoY from ¥2.9 billion; margin: -2.3%).
- Profit Before Tax: -¥5.9 billion (down ¥5.7 billion YoY from -¥0.2 billion; margin: -3.9%).
- Profit Attributable to Owners of the Parent: -¥4.1 billion (down ¥4.3 billion YoY from ¥0.2 billion; margin: -2.7%).
- Free Cash Flow: -¥13.7 billion (down ¥21.5 billion YoY).
For 1H (April-September 2025):
- Revenue: ¥312.9 billion (-6.0% YoY from ¥332.7 billion).
- Operating Profit: -¥4.8 billion (down ¥10.6 billion YoY from ¥5.8 billion; margin: -1.5%).
- Profit Before Tax: -¥5.2 billion (down ¥9.6 billion YoY from ¥4.4 billion; margin: -1.7%).
- Profit Attributable to Owners of the Parent: ¥5.3 billion (+80.7% YoY from ¥2.9 billion; margin: 1.7%), boosted by deferred tax assets from subsidiary dissolution.
- Free Cash Flow: -¥23.0 billion (down ¥22.8 billion YoY).
- Exchange rates averaged US$146 and EURO ¥168 for 1H, with tariffs impacting operating profit by -¥2.9 billion.
Compared to the August 2025 forecast, 1H revenue was nearly on target, while operating profit exceeded expectations (+¥3.2 billion) due to an early business transfer gain and cost controls.
Segment Breakdown (1H Results)
The table below shows revenue and operating profit by segment, with YoY changes and margins.
| Segment | Revenue (¥B) | YoY Change | Operating Profit (¥B) | YoY Change | Margin |
|---|---|---|---|---|---|
| Imaging Products | 145.0 | -6.7 (-4.4%) | 15.1 | -13.7 (-47.5%) | 10.4% |
| Precision Equipment | 69.8 | -11.7 (-14.3%) | 3.0 | +2.1 (+222.6%) | 4.4% |
| Healthcare | 51.2 | -3.9 (-7.1%) | 0.3 | -1.0 (-73.8%) | 0.7% |
| Components | 35.1 | +4.7 (+15.4%) | 5.2 | +3.8 (+255.4%) | 15.0% |
| Digital Manufacturing | 9.8 | -1.9 (-16.2%) | -8.9 | -2.5 | -91.2% |
| Others | 1.8 | -0.2 (-13.5%) | -19.6 | +0.7 | – |
| Total | 312.9 | -19.8 (-6.0%) | -4.8 | -10.6 | -1.5% |
- Imaging Products: Declines driven by FX effects, tariffs, and product mix shifts, offset by higher volumes (e.g., Z5II and Z50II cameras). Sales volumes: 480k digital cameras (+70k YoY), 670k lenses (+20k YoY).
- Precision Equipment: Lower revenue from fewer ArF lithography systems, but profit up due to a ¥2.1 billion net gain from transferring wafer bonding R&D and restructuring.
- Healthcare: Impacted by FX and U.S. grant cuts in Life Science; stronger Eye Care sales in the West provided some offset.
- Components: Growth in video measuring systems and FPD photomask substrates; profit boosted by prior restructuring.
- Digital Manufacturing: Lower sales of large-format metal 3D printers led to wider losses.
Regional revenue split (1H): Japan 15%, US 25%, Europe 18%, China 17%, Others 25%.
Highlights and Management Commentary
- Launched the “ZR” digital cinema camera with RED technology and expanded mirrorless lens lineup to 50 models.
- Progress in partnerships (e.g., SCREEN for wafer bonding) and subsidies for drug discovery support.
- Restructuring efforts include dissolving Nikon Metrology NV (tax benefits) and Yokohama Plant sale for balance sheet efficiency.
- EssilorLuxottica holds a 10.75% stake (up to 20% cleared).
- One-time items: ¥2.1B gain in Precision Equipment, offset by ¥0.9B investigation costs in Healthcare and ¥1.1B reorganization expenses.
- Focus on balancing short-term recovery with long-term growth in the upcoming Medium-Term Management Plan (FY2027-2031).
Updated Full-Year FY2026 Forecast
Revised downward due to 1H results and adjustments in Precision Equipment and Digital Manufacturing, partially offset by upward revisions in Imaging and Healthcare. Assumed rates: US$146, EURO ¥169; tariffs: ¥7.5B impact.
- Revenue: ¥680.0 billion (-4.9% YoY; -2.9% vs. prior forecast).
- Operating Profit: ¥14.0 billion (+¥11.6B YoY; -¥7.0B vs. prior; margin: 2.1%).
- Profit Before Tax: ¥16.0 billion (+¥11.5B YoY; -¥9.0B vs. prior; margin: 2.4%).
- Profit Attributable to Owners: ¥20.0 billion (+¥13.9B YoY; -¥7.0B vs. prior; margin: 2.9%; EPS: ¥60.78).
- ROE: 3.1% (+2.2% YoY).
- Dividends: Interim ¥25, annual ¥50 (unchanged).
Segment forecasts:
| Segment | Revenue (¥B) | YoY Change | Operating Profit (¥B) | YoY Change | Margin |
|---|---|---|---|---|---|
| Imaging Products | 290.0 | -5.3 | 32.0 | -9.3 | 11.0% |
| Precision Equipment | 163.0 | -38.9 | 5.0 | +3.5 | 3.1% |
| Healthcare | 114.0 | -2.4 | 5.0 | -1.7 | 4.4% |
| Components | 78.0 | +2.9 | 12.0 | +2.9 | 15.4% |
| Digital Manufacturing | 32.0 | -0.4 | -10.0 | -3.4 | -31.3% |
| Others | 3.0 | -0.2 | -30.0 | +5.6 | – |
| Total | 680.0 | -35.2 | 14.0 | +11.6 | 2.1% |