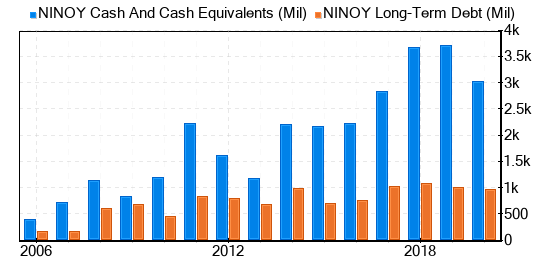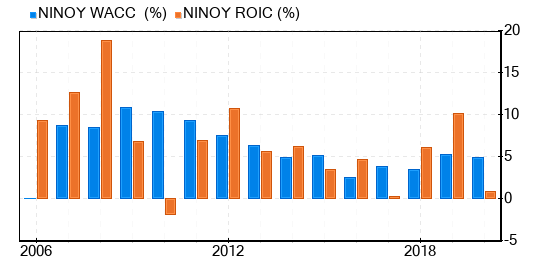
Some interesting financial graphs from a recent article on Nikon’s stock price that show the company’s performance over the past 15 years (the actual article doesn’t provide any other interesting information, so I will include the graphs in this post):


Via Yahoo
- Get 15% off on all Topaz Labs products with code RUMORS15
- Get 20% off on all ON1 products with code NIKONRUMORS
- Get 10% off all Viltrox lenses with code NIKONRUMORS
- Get 5% off Funleader lenses with code LEICARUMORS
- Get $10 off Luminar with code NIKONRUMORS
- 10% bonus on gear trade-in at KEH (no coupon needed)
- 15% off Capture One Nordic Style Kit (no coupon needed)


