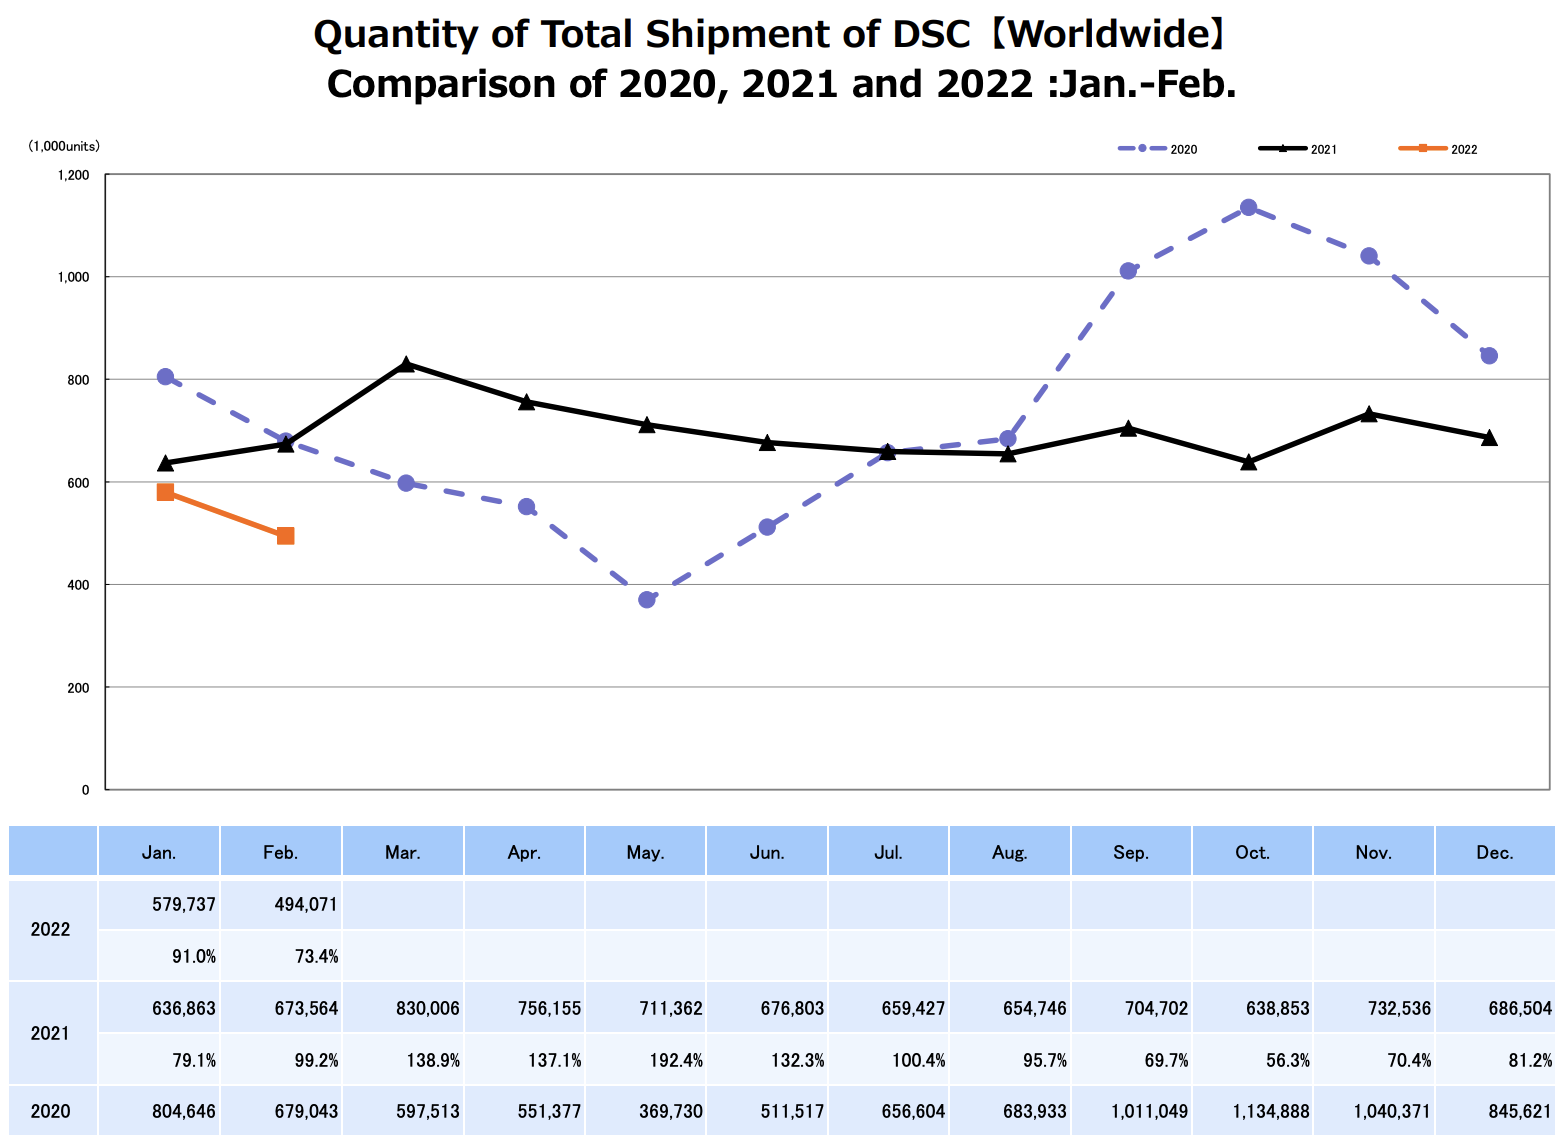
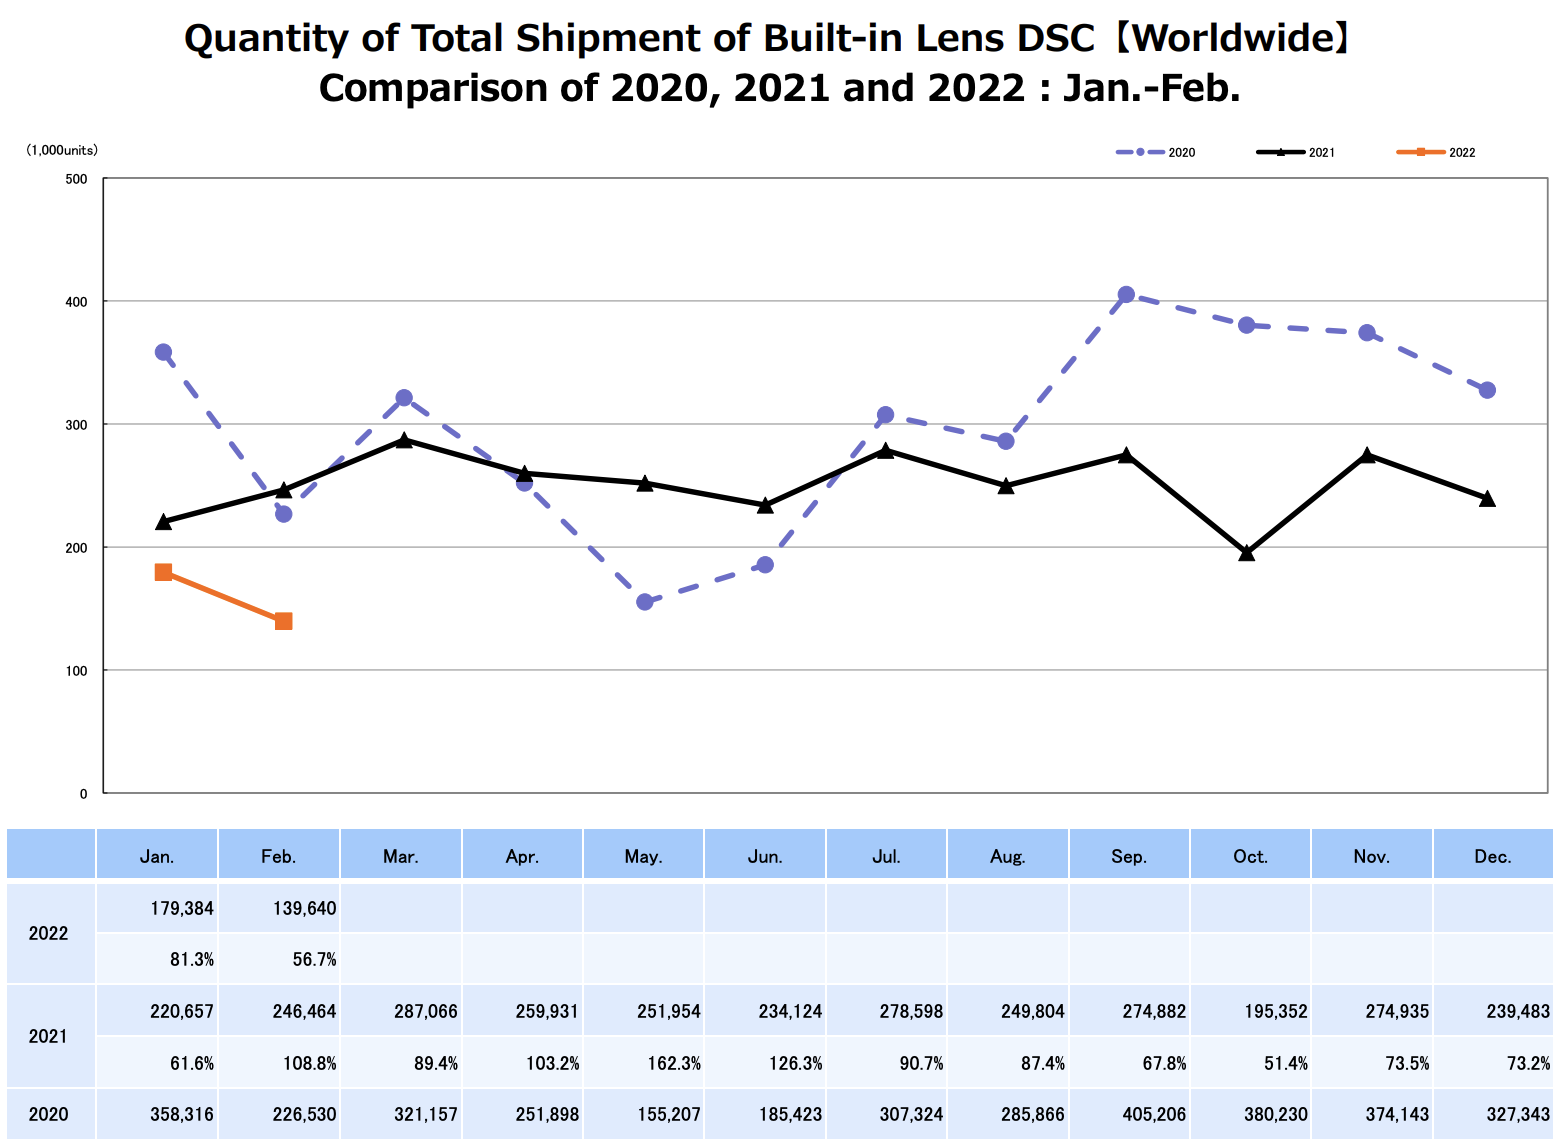
CIPA (Camera & Imaging Products Association in Japan) published their latest camera production data (orange: 2022, black: 2021, blue: 2020):
February 2022 CIPA numbers by ZoetMB
CIPA has predicted 5.29 million DSLR and Mirrorless bodies for 2022. We’re predicting 4.0 to 4.5 million (down from our January prediction). compared to:
Jan-Feb 2022 Units & Shipped Value:
(All comparisons to YTD 2021)
DSLR Units : 326K –16% YTD
DSLR Shipped Value: ¥12.9 billion –16% YTD
Mirrorless Units: 428.6K –5% YTD
Mirrorless Shipped Value: ¥49.1 billion +13% YTD
Compact Units: 319K –32% YTD
Compact Shipped Value: ¥8.732 billion –10% YTD
Lenses for smaller than 35mm Units: 696K –11% YTD
Lenses for smaller than 35mm Shipped Value: ¥10.874 billion +3% YTD
Lenses for 35mm and larger Units: 675K, +4% YTD
Lenses for 35mm and larger Shipped Value: ¥42.4 billion +35% YTD
Cumulative 2022 Mirrorless unit share (of Mirrorless + DSLR): 56.8% (was 53.7% YTD 2021)
Cumulative 2022 Mirrorless Shipped Value share: 79.1% (was 73.9% YTD 2021)
The ratio of lenses shipped to bodies shipped is 1.82 for YTD 2022. It was 1.7 for YTD 2021.
Year to Date 2022 Geographic Share:
DSLR:
Units: China 11.9%, Asia (not incl. China or Japan) 10.5%, Japan 3.1%, Europe 41.1%, Americas 31.9%, Other 1.6%
Shipped Value: China 18.8%, Asia (not incl. China or Japan) 14.5%, Japan 4.6%, Europe 33%, Americas 28.2%, Other 1.4%
Mirrorless:
Units: China 18.4%, Asia (not incl. China or Japan) 18.6%, Japan 7.8%, Europe 26.1%, Americas 25.8%, Other 3.2%
Shipped Value: China 18.3%, Asia (not incl. China or Japan) 19%, Japan 7.8%, Europe 23.7%, Americas 27.5%, Other 3.8%
Compacts:
Units: China 9%, Asia (not incl. China or Japan) 12.6%, Japan 27.4%, Europe 28.5%, Americas 18.5%, Other 4.1%
Shipped Value: China 14.6%, Asia (not incl. China or Japan) 14.3%, Japan 19%, Europe 29.6%, Americas 19.1%, Other 3.5%
Lenses:
Units: China 14.2%, Asia (not incl. China or Japan) 14.4%, Japan 7.6%, Europe 33.5%, Americas 26.9%, Other 3.5%
Shipped Value: China 16.%, Asia (not incl. China or Japan) 15.2%, Japan 9.8%, Europe 28.5%, Americas 25.7%, Other 4.2%
List of participating CIPA companies can be found here (thanks ZoetMB).
The last time we had “all green” CIPA numbers was June last year: